Central Limit Theorem

The Central Limit Theorem or CLT is considered to be the second fundamental theorem of statistics, the first being the law of large numbers. The CLT applies to a sampling distribution of the mean, where all samples have been drawn from the same parent population.
Statement of the Central Limit Theorem
Essentially, the Central Limit Theorem (CLT), also known as the Central Theorem, states that:
- The expected value (equivalent to the mean) of a sampling distribution of the mean is equal to the mean of the parent population.
- The standard error (equivalent to the standard deviation) of a sampling distribution of the mean is equal to the standard deviation of the parent population divided by the square root of the sample size.
- Irrespective of the underlying distribution of the parent population, the sampling distribution of the mean increasingly reaches the normal distribution, as the sample size increases,. This is one of the most important elements of the Central Limit Theorem and explains why so many natural phenomena can be described with the Normal distribution.
Mathematical
Description of the CLT:
Mathematically, the Central Limit Theorem is expressed as:

and

Where
= mean of the sampling distribution
= standard error of the sampling distribution
= mean of the sampling distribution
= standard deviation of the population
The Concept Behind the
Central Limit Theorem
The concept of the CLT is closely related to the law of large numbers, and the Chebyshev's theorem, both of which explain the behavior of stochastic probability characteristics of a population, as the sample size increases.
- Law of Large Numbers: It states that, the mean value of a trial will increasingly become equal to the expected value as the number of trials increase. For example, the expected value for a roll of die is 3.5 (= ). According to the law of large numbers, as the sample size (the number of die rolls) increases, the average result increasingly approaches 3.5.
- Chebyshev's Theorem: It states that, in any stochastic probability distribution (which describes the behavior of random processes), the proportion of the population that is more than k standard deviations away from the mean, is always less than 1/k2.
Example of the Central
Limit Theorem
- Toss 10 coins simultaneously, once. Count the number of coins that show heads.
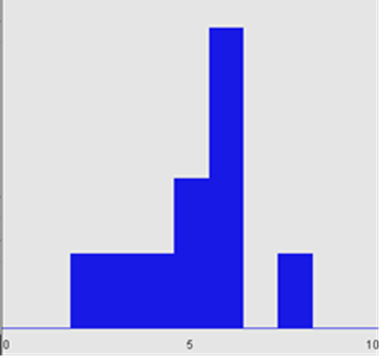
- Toss 10 coins simultaneously, ten times. Add the number of coins that show heads from each toss. Plot a graph of number of coins that show heads (0-10) versus number of tosses (1-10).
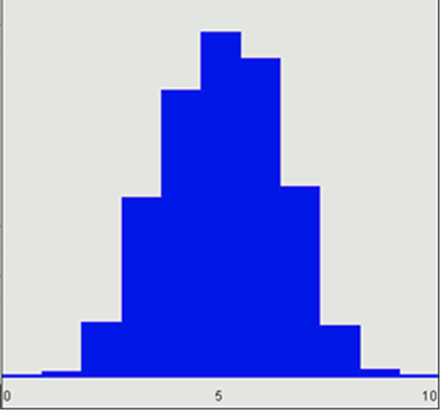
- Toss 10 coins simultaneously, 500 times. Add the number of coins that show heads from each toss. Plot a graph of number of coins that show heads (0-500) versus number of tosses (1 - 500).
According to the Central
Theorem, for 10 coins, the expected value of coins which will turn up heads is
5; the probability that only 2 or 8 of the tossed coins will turn up heads is
lower than the probability of the sample mean.
Below is the graph for
ten coins tossed 10 times. It shows that the number of heads is evidently close
to the expected value. However according to the Central Limit Theorem, since
the sample size is small, the true approximation of the normal distribution is
not seen.

When the sample size is increased and ten coins are tossed 500 times, the number of coins that turn up heads for the most times are 5. Right according to the Central Theorem, the sampling distribution approximates a normal distribution even though the underlying population distribution is not normal.

Summary
The central limit theorem states that the means of the sampling distribution will approximate a normal distribution as the number of samples increases. This gives you the license to use the normal distribution even in situations where the population distribution is not normal.
Frequently Asked Questions
What does the Central Limit Theorem refer to exactly?
The Central Limit Theorem is a concept that arises in statistics and is utilized to analyze the behavior of the sample mean for a given random variable when the sample size is large enough. According to the theorem, the distribution of the sample mean becomes normal, regardless of the original distribution of the population that the sample is drawn from. This theorem is extensively applied in statistical hypothesis testing and inference.
Why is the Central Limit Theorem Important?
Understanding the Central Limit Theorem is important since it permits making predictions and drawing inferences about a population based on a sample. By comprehending the distribution of the sample mean, we can estimate the population mean and make predictions with a certain degree of confidence. This theorem is used in several fields, including the social sciences, biology, and economics.
What Prerequisites Make the Central Limit Theorem Valid?
The Central Limit Theorem is based on several assumptions that need to be satisfied. These include random sampling, independence of observations, and a finite population variance. Additionally, the sample size must be sufficiently large, typically greater than 30, for the theorem to be applicable. When these conditions are met, the Central Limit Theorem can be applied to estimate population parameters with a high degree of accuracy.
