Standard Normal Distribution
The standard normal distribution or SND is a normal distribution with zero mean and a standard deviation = 1. The normal distribution can model most natural world phenomena. According to the Central Limit Theorem, even if a population is not normally distributed, a large number of samples with size greater than 20 will result in a sampling distribution that is approximately normal. With the SND for the parent population mean to fall within specified ranges can be estimated from the probability distribution table of the normal distribution.

A normal distribution is known by the characteristic bell shaped curve of its probability distribution function (PDF). Mathematically, the PDF of normal distribution is expressed as

Where μ is the mean, and σ2 is the variance of the distribution.
Bell Curve
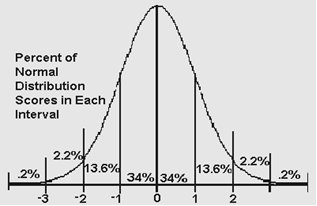
The bell curve of different normal distributions can vary in height meaning the probability of the distribution to assume mean value. It can also vary in width or the range of the distribution. However, the graph of an SND, for which mean = 0 and standard deviation = 1, is always the same.

Properties of the Standard Normal Distribution
- The mean of the SND is 0 and the standard deviation is 1.
- The distribution is symmetric about the mean.
- Total area under the curve is 1.
- Areas under the curve at specific values along the x-axis can be found using normal distribution tables.
- 68% of the population lies within one standard deviation from the mean.
- Approximately 99.5% of the population lies within three standard deviations from the mean.
Z Scores for the Standard Normal Distribution
The mean values of the SND are plotted along the x-axis. In order to compare any normal distribution (any value of mean, and any value of standard deviation) to the SND, the values of the z-score are computed as:

Where x is the raw value from the given normal distribution to be standardized, is the population mean and is the population standard deviation. Probabilities are then read from probability distribution table, against the values of normalized z-score. Conversely if a z-score is known, it can be used to calculate sample size, calculate standard deviations or calculate population mean.
Example Using Standard Normal Distribution
Consider a scenario where the average age of workers in a plant is 30 with standard deviation of 4. We want to find the probability that a worker picked at random will have age less than 40.
- Calculate z-score as z = (40 - 30)/4 = 2.5
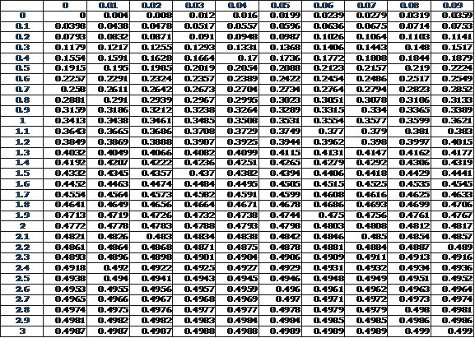
- Refer to the SND table below.

- Area under the curve between 0 (age = 30) and z = 2.5 (age = 40) is 0.4938.
- Area under the curve to the left of 0 is 0.5
- Since we want probability for age < 40, not only 30 < age < 40, so we add the two areas (to the left of z=0, and the area between z=0 and z=2.5) = 0.5 + 0.4938 = 0.9938
- Probability that a worker picked at random will have age less than 40, P(x<40) = P(z<2.5) = 0.9938 = 99.38%
T-Score Table for the t-Distribution
When the sample size is small (< 30), we use the t distribution, not the normal one. The t-Distribution is like the normal distributions but for limited data. Similar to z-score tables for SND, there are t-score tables for t-Distributions according to different sample sizes.
Summary
The standard normal distribution is a representation of all normal curves. This includes any combination of mean and standard deviation. Tables of values from this distribution can be used to evaluate any normal distribution.
Frequently Asked Questions
What is the standard normal distribution?
The standard normal distribution is a probability distribution with a mean of zero and a standard deviation of one. It is a bell-shaped curve that is symmetric about the mean and is widely used in statistics and probability theory.
How is the standard normal distribution different from other normal distributions?
The standard normal distribution has a mean of zero and a standard deviation of one. Other normal distributions can have any mean and standard deviation. The shape of the curve is always the same, however. The highest point is at the mean and there is a symmetrical distribution on either side of the mean.
What are some properties of the standard normal distribution?
The standard normal distribution is continuous and unimodal, meaning it has only one peak. The area under the curve is equal to 1, and it is symmetric about the mean. About 68% of the observations in a standard normal distribution fall within one standard deviation of the mean, and about 95% fall within two standard deviations.
In what ways does statistical analysis incorporate the standard normal distribution?
The standard normal distribution serves as a benchmark distribution for contrasting other normal distributions or normalizing data. The technique of standardizing or normalizing entails modifying the data so that it assumes a mean of zero and a standard deviation of one. This approach simplifies the task of comparing data from disparate sources or conducting statistical analyses.
