
Understanding data with small samples
|
In statistics, the sampling distribution (SD) refers to the distribution of a given statistic of the equally sized samples from the same population. Examples of such statistics include mean, median, mode, standard deviation, variance, range etc. In order to understand the SD, we shall review the concepts of probability distribution, population and sample. |
The probability distribution for a variable is the probability, that, the variable will assume a certain value (discrete variable), or that the variable will fall within a particular interval (continuous variable) over the entire range of values possible for that variable.
A statistical population consists of the entire set of entities which are under statistical investigation.
A subset of the population is termed as the sample, whose descriptive statistics (mean, median, range, variance etc) are determined in a way that the corresponding descriptive statistics of the population can be estimated.
If the monthly income of all the males within 25 and 35 years of age from a certain city is to be determined, surveying the entire male population of the city will be a cumbersome and high-cost task. Instead, one or more representative samples from the population are selected, and they are used to statistically compute the monthly incomes for the entire city's 25-35 years old males.
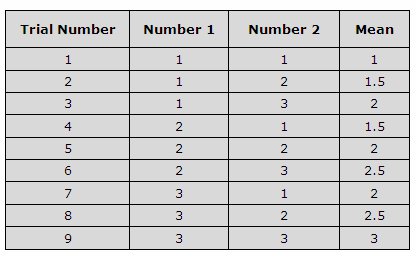
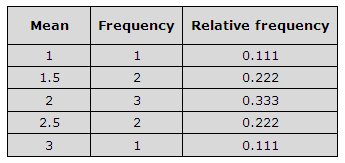
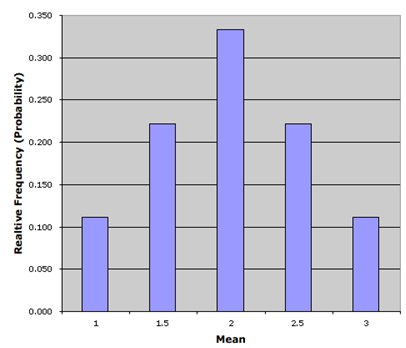
Evidently, if twenty such samples, each comprising of 30 individuals are selected, the descriptive statistics for each sample would not be the same but be spread over a certain range. That is, the mean (or variance, or range) of one sample may be close to the mean (or variance, or range) of another sample but will not be the same. The resulting distribution is termed the sampling distribution of that statistic. For example, the distribution of mean values for all the samples is called the SD of the mean.
A probability distribution for a population is described with parameters i.e. mean ( ), median (M) and standard deviation
(σ). A SD can also be described with similar parameters. For example, the expected value for a SD of a mean, represented by the symbol
), median (M) and standard deviation
(σ). A SD can also be described with similar parameters. For example, the expected value for a SD of a mean, represented by the symbol  , the standard error (analogous to standard deviation) for a sampling
distribution of the mean represented by the symbol
, the standard error (analogous to standard deviation) for a sampling
distribution of the mean represented by the symbol  , and the median of a SD of the mean represented by
the symbol
, and the median of a SD of the mean represented by
the symbol  .
.
|
A sampling distribution is the distribution of a given statistic, for a number of equally sized samples from the same population. It depends upon the distribution of the underlying population, the sample size and the statistic being considered. Like the probability distribution of a variable for a population, the SD for a number of samples from the population can be described with parameters such as the standard error and the expected value. |

The links below are specific questions and answers about statistics and how to use them.