
All normal probability distributions have some special properties. Because the probabilities are very well known, it is a very powerful tool. When you know that your data is normally distributed, then you can state with certainty what the probabilities are for the 1st, 2nd, 3rd or any decimal number of standard deviations away from the mean or average.
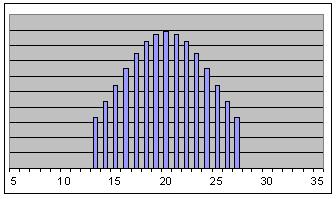
When you want to know the probability of having a given number of standard deviations from both sides of the mean as shown in the graph:
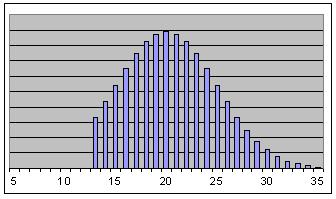
This can apply to one tail cut off of either side. Since the normal distribution is symmetrical it makes no difference. It is often more useful to have probabilities for only one side:
The numbers given above for the 1st thorough the 3rd standard deviations away from the mean are useful guidepost numbers to remember when working with normal probability distributions. When actually applying this to a real situation, you will want to calculate the probabilities with a calculator or normal probability tables. For example, you might want to know the range of numbers to ensure that you have a 90% probability that a data point will fall within that range. For a two tailed range that is symmetrical around the mean the range is &plusnm 1.65 standard deviations from the mean. Assume your data set has a mean of 20 and a standard deviation of 5. The range of numbers that would have a 90% probability is 11.75 to 28.25.
The normal probability distributions are very well understood. They are also one of the most common distributions. With the knowledge garnered here and on the other pages of this site, you can know what probabilities to expect when the mean and standard deviation are known.

The links below are specific questions and answers about statistics and how to use them.