Example of a Normal Distribution
This example of a normal distribution can help your understanding of basic statistics.

The normally distributed statistical process is one of the most basic continuous probability distributions.
A normal distribution is a probability distribution that looks like a bell-shaped curve. It is also called a Gaussian distribution or bell curve. The shape of the normal distribution depends on the mean and standard deviation of the data, in particular, its location and width.
The most common representation of the normal distribution is the so-called "bell curve" in which the mean, median, and mode are at the midpoint of the scale and most of the data are near this midpoint with fewer data points as one moves away from it towards either tail.
Most real world stochastic phenomena (whose mean and variance can be computed) exhibit a behavior that can be characterized by a normally distributed variable.
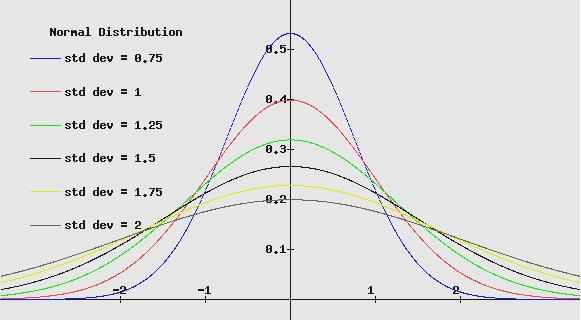
This graph of the probability density function (PDF) for normally distributed stochastic process with different values of standard deviation (square root of variance) is given below. As the variance or standard deviation increases, the height of the characteristic bell shaped curve (the probability of the variable to cluster closely around the mean value) decreases. A normal distribution also exhibits a normally distributed histogram, provided sample size is very large. This type of distribution has one mode, or peak, at its center and symmetrical tails that extend out in either direction.
Properties of a Normally Distributed Distribution
- The mean divides the curve area exactly into halves.
- A normally distributed process is completely described with two parameters: the mean and the variance.
The Mathematics of the Normal Distribution

This is the formula for the normal distribution. The variables and constant of the equation are:
- The mean or the average is represented by μ
- The variance or variability of the distribution is represented by σ
- The standard deviation is more commonly used as the measure of variability. It is the square root of the variance
- X is an individual observation within the distribution
- Pi or
π is a constant of 3.14159
Example of a Normal Distribution
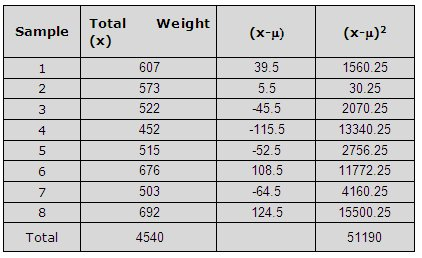
A hunter organization wants to know the distribution of weights of elk in their hunter preserve. The distribution of weights of elk in the hunter preserve can be modeled with a normal distribution.
The random sample of 8 elk weights is small. This will probably result in a large standard deviation. However, if this is the only sample available, it will give some idea of the actual weights of the elk population


Variance is a measure of the dispersion of a set of data from its mean Calculating the variance:

One can then find the standard deviation from the variance by simply taking the square root of the variance:

The density function for the normal distribution can then be constructed:

Other Important Statistical Distributions
Some other fundamental statistical probability distributions are:
- Uniform Distribution: The uniform distribution is a type of probability distribution where the variable has equal probability of assuming any value over the range of possible values. This distribution is often used in computer programming to generate random numbers that are uniformly distributed. This type of distribution is also used when sampling from a population, as it ensures that every member of the population has an equal chance of being selected. As opposed to the normally distributed probability function which is bell shaped, uniform distribution probability density function is a horizontal line. Below graph shows the probability density function versus values of the variable.

- Lognormal Distribution: The Log-normal distribution is the distribution of a random variable whose logarithm is normally distributed.
- t Distribution: A t
distribution is achieved while estimating the mean of a normally distributed
population when the sample size is small. So with the above example the t Distribution would probably do a better job of estimating the mean because of the small sample size.
- Gamma Distribution: It is a family of distributions that vary greatly in characteristics depending upon its scale parameter (which describes the spread of the distribution) and its shape parameter (which describes the characteristic shape of the distribution).
Summary
Normally distributed statistical processes display one of the fundamental statistical probability distributions i.e. the normal distribution. The distribution can be completely described with just two parameters: the mean, and the variance or standard deviation. The graph of probability density function of normal distribution is a characteristic bell curve, which is symmetric about the mean. The value of knowing the parameters of a distributions normal curve is in calculating probabilities, which are used to make predictions about future events. So that means if a normal population has a calculated standard deviation from a sample then we would expect the following:
- 68% of the population within + or - of one standard deviation from the mean
- 95% of the population within + or - of two standard deviations from the mean
-
99% of the
population within + or - of three standard deviations
from
the mean
Other important probability distributions include uniform distribution, lognormal distribution, t distribution and gamma distribution.
Q: What is business analytics' normal distribution and how does it apply to business?
A: The normal distribution is a probability distribution that is frequently utilized in business analytics to describe and analyze data. It is also known as the bell curve or the Gaussian distribution due to its symmetrical bell shape.
The normal distribution is utilized in numerous ways to enable well-informed business decisions. The following are some of the most common uses of normal distribution in business:
Forecasting: The normal distribution is often used by business analysts to make predictions about upcoming trends or events. They might make use of it, for instance, to forecast future sales based on historical data.
Risk Assessment: Normal distribution is also used in risk assessment. It can be used, for instance, to determine the likelihood of a particular outcome by utilizing data from the past.
Assurance of Quality: The normal distribution is utilized in quality control to ascertain whether a procedure or product falls within a predetermined range of acceptable values. It can be used, for instance, to determine whether a batch of products meets a particular quality standard based on the measurements of each product.
Pricing and Valuation: The normal distribution is utilized in both pricing and valuation. Modeling stock prices or determining an option's fair value are two examples of applications for it.
Customer Segmentation: Normal distribution divides customers into groups based on their spending patterns or other behaviors. Using this data, marketing campaigns can be targeted more effectively and business decisions can be based on more information.
In general, normal distribution is a useful tool in business analytics that helps businesses make well-informed decisions and gain useful insights from data.
Standard Normal Distribution - The model for all normal distributions.Normal Probability Distribution - The most common distribution in nature and business.
Normal Probability Graphs - What the normal distribution looks like.
