The binomial distribution (BD) is one of the most important distributions in statistics. This distribution is the discrete probability distribution (the variable can take
only fixed values) of the number of successes in n independent trials, each with the same probability of success or failure.
Suppose a coin is tossed ten times. The probability of the coin showing heads or tails is ½ (p=0.5; both are equally
likely). The BD for this success /failure experiment (also known as a Bernoulli trial), expressed as b
(10,5) is the probability distribution of how many times the coin will show heads.
Processes That Exhibit A Binomial Distribution
BDs are characteristic outcomes of the processes in which following conditions are met:
The process consists of n repeated trials.
The probability of success (p) or failure (1-p) is the same for each trial.
Each trial can have only two outcomes.
The result of one trial does not affect the result of any other trial.
Statistics of Binomial Distribution
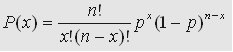
The probability of success in the x trials out of a total of n trials, where probability of success in one trial is p is:
The mean of the BD is:
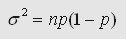
The variance of the BD is
Example of Using the Binomial Distribution:
Toss a coin for 20 times. Since a coin is equally likely to show heads or tails (binomial probability=0.5), the number of tosses
that are expected to show heads is about 10. According to the above equations,
Mean, = 20 x 0.5 = 10
Variance = 20 x 0.5 x 0.5 = 5
Standard deviation = 5 = 2.23
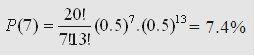
Probability that 7 out of 20 trials will show heads
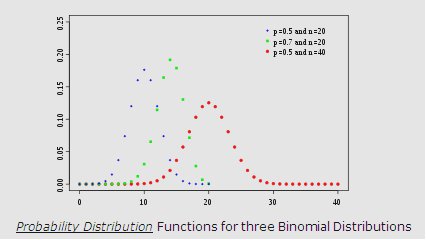
The probability distribution function for this experiment is shown in the below figure in blue.
Now toss the coin for 40 times. The BD for this experiment will be more spread, with a lower probability
value at mean than the experiment above. This is because the experiment can produce results over the wider range.
The probability distribution function for this experiment is shown in the below figure in red.
Suppose an experiment consists of 20 trials, where probability of success in each trial is 0.7 and probability of failure is 0.3. The resulting
distribution will not be symmetric about the mean because more trials are likely to result in success than in failure.
The skewed plot of this probability distribution function is shown in the figure in green.
Normal Approximation of the Binomial Distribution
If the number of trials is large (n>20) and the probability of success and failure are almost equal, then the binomial
distribution can be approximated by the normal distribution. This approximation is useful to find an unknown probability of
success/failure by using a fairly large number of trials (for example, asking 100 people if they like a particular brand of
shampoo etc).
Summary
The binomial distribution is a discrete probability distribution which describes the probability of success (or failure)
of a Bernoulli experiment. A Bernoulli experiment consists of n repeated trials of the same type, each with the same
probability of success (p) or failure (1-p),
and a trial can only have two outcomes (YES/NO, success/failure etc). The
distribution can be approximated by the normal distribution, if a large sample is used (n>20).