
Knowing how the data varies leads to understanding the data.
To answer the question of what is standard deviation you must refer to the question raised in mean average. The mean or average have little value without some measure of the variability of the data. Standard deviation to the rescue!
The standard deviation is a measure of the variability of the distribution of a random variable.
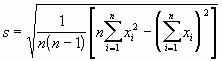
It must be noted that this formula is for the sample and not for the population. If you don't know what this means, don't worry about it. For simple applications it makes little difference.
A word description of the steps needed to calculate the standard deviation:
Now that you have seen the formula, let's describe what is happening in simpler terms. The formula is simply finding the average distance each data point is from the dataset mean. The squared numbers is a mathematical way of making all of the distances positive. So here is our measure of a datset: First we find the average of the data points, then we find the average of the distance each data point is from the mean or average of the data. This gives us a good beginning in describing the data within a datset.
The question of explaining standard deviation has been addressed herein. It is the average of the distance from the mean of all the data points in the dataset. To see an example of how this parameter is calculated go to Standard Deviation Calculation.
