
Control Charts
Chart a process for stability
|
Control charts (CC) are practical applications of statistics for improving industrial and commercial activities. Their most common use is found in statistical process control and statistical quality control. In essence, CCs are used to observe and control the selected process characteristics over time. |
The Control Chart Explained:
A CC is a graph on which x-axis describes the time scale or unit of activity/product and y-axis describes the process range.
Values along the y-axis represent a key statistic of the process e.g., mean, proportion, range etc.
The units of the x-axis are selected according to the process being monitored (hours, weeks, cars, travel time etc).
The process being monitored is measured at the regular or random intervals (for examples: after every hour, every fourth truck leaving a warehouse, 4 toys selected randomly every hour at a production plant).
The desired value of the process is considered the process mean, and a horizontal line is drawn from the y-axis at the mean value.
A CC is identified by two or more horizontal lines drawn on either side of the mean line. These lines are called upper control limit (UCL, above the mean) and lower control limit (LCL, below the mean), which describe the limits within which the process should remain.
The control limits are typically drawn at multiples of standard deviations. For example, the upper control limit may be drawn at the mean + 3 standard deviations and the lower control limit may be drawn at the mean - 3 standard deviations.
Optionally, upper and lower warning limits may be drawn, for example at mean + 2 standard deviations and mean - 2 standard deviations.
Usage of Control Chart:
Control charting is an efficient mechanism for the statistical process control. The values of the control statistic, plotted along the time/activity scale, should remain within the control limits. An abnormal dispersion about the mean (e.g., most of the points are located below the upper control limit but above the mean), or plot-values crossing either of the control lines, indicate that the process needs correction. Many commercially available statistical process control software provide this functionality.
In statistical quality control and quality assurance, CCs are vital tools. The behavior of the chart points indicates if the correct process limits have been selected, or if the process is suffering from a flaw. Control chart may also be used to analyze process variation due to the routine and special causes.
Example of Control Charting:
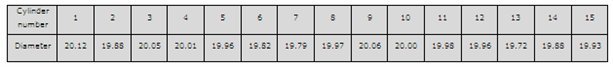
Consider a machine that produces metallic cylinders, each of which should have a diameter of 20 inches, and variation in the cylinder diameter should not exceed 0.25 inch. Thus, mean= 20, UCL= 20.25, LCL= 19.75 inch.
15 cylinders are randomly selected during one hour, and diameters are noted as follows:
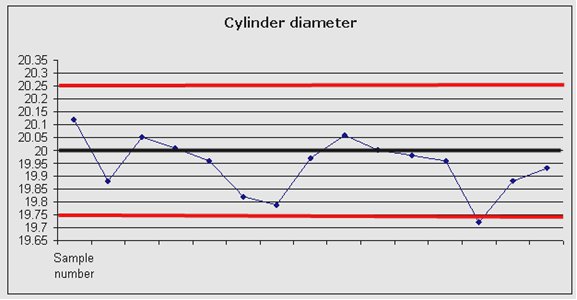
A CC based on above standards and observed values, is plotted below. Notice the mean line and the control limits. Majority of the measurements are below the mean, and the chart indicates the process correction.
Summary
|
CC or quality control charts are a vital statistical process control and statistical quality control tool. It is made up by selecting control statistics recorded against measurement scale. Process range is noted on the y-axis; a horizontal line is drawn at the mean value, upper control limit line is drawn at the maximum acceptable value of the process and lower control limit is drawn at the minimum acceptable value. The plot of the process indicates whether the process is in control or some corrective action is required. |
Search For More Business Analysis Information

© 2006 - 2014 Stellar Force
Do You Want To Understand Statistics Better?
The links below are specific questions and answers about statistics and how to use them.